This post continues the research of top 100 Australian eCommerce websites. After reviewing the popularity of eCommerce platforms, we decided to check how well the top online stores are optimised. Note that here we are referring to the technical performance or simply, how quickly the websites load, factors that can be easily measured with the right tools. User experience for mobile rendering is also taken into account.
Why site speed is important?
Slow site equals bad user experience
It is 2016 and nobody likes a slow website. Numerous research shows a clear correlation between website load speed and conversion. The faster your website loads, the more people will use it and eventually purchase. As a rule of thumb a 1 second delay results in a 7% drop in conversion. Even if a customer converts with a slow performing website, there is a good chance that the sub-standard experience will drive the user not to return.
Harm to search engine ranking
Another extremely important consideration is that search engines (namely Google) are penalising slow websites. So in addition to losing customers, there is also risk that you are loosing ranking to other players in your vertical.
How was the research conducted – methodology
The list of top Australian retailers were taken from Power Retail – “The 2015 E-Commerce Leaders’ Playbook“.
To find out how the top 100 Australian retail websites performed, we adhered the following checks:
- Measured Google PageSpeed Score with a tool from Google – both mobile and desktop. We also checked the User eXperience (UX) score for the mobile website.
- Measured the website speed load with a Website Speed Test tool from Pingdom. Using this tool, we were able to measure, the performance grade, speed load, number of requests and the size of the web page. The tests were conducted from an Australia server. The Pingdom tool emulates a real world situation when a website is loaded by a user (they use Google Chrome browsers), not some artificial speed test.
- In additional we’ve tried to identify an eCommerce platform that powers a website. We were able to do that in around 2/3 cases
Websites were researched manually in normal work time (from 9 am to 5 pm AEST). It is important to note that the measurement results, especially load time can deviate quite significantly for the same website depends on a number of factors, like hosting or other hardware or software.
The findings
At a glance, the results across the board, you can use it to have

Average numbers
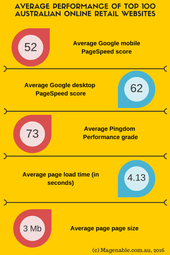
- Google Mobile PageSpeed Score – 52/100
- Google Mobile PageSpeed Score – 62/100
- Google Mobile UX – 96/100
- Pingdom Performance grade – 74/100
- Number of requests – 159
- Loading time -4.13 sec
- Page size – 3 Mb
It’s good to see high average Google mobile UX ratings, which means that the websites are well optimised for mobile devices. 9 websites scored 100 and the lowest score was 60.
On the other hand, Google Page Speed scores (especially mobile) don’t look so good. One website scored just 3 out of 100, another – 18. Fifteen websites scored less than 40 and for 5 of the websites the Google PageSpeed Insight tool was unable to calculate a score at all. With desktop versions, the situation is a bit better, with the lowest score being 9. The Google tool did not score four of the websites.
Results of the performance score measured with Pingdom page speed tool are higher in general (with an average of 74 out of 100) and showed less variance. The lowest performance score is 52, so there are not so many websites that were judged poorly on this metric.
Page load speed varies much more significantly. The slowest website took 13 seconds to load and there were 4 websites that loaded in over 9 seconds and 15 that loaded in over 6 seconds. It is interesting to note that our results, on average show a much better loading speed than the benchmark shown by Dynatrace (see Reference section for a link). Maybe top retailers put more efforts in performance optimisation since that data was published or perhaps it is more related with the off-peak season.
Pages size varies quite significant as well, from 0.5 to 17 Mb with 11 websites having a home page heavier than 5 Mb.

It is interesting that and you can notice it at the scatter plot above that the correlation between page size and load time isn’t very high (the correlation is equal to 0.25), so page size is only one factor affecting load speed.
Leaders, top 10 websites in different categories
In this section will talk about the leaders, Australian eCommerce websites that performed the best by different performance metrics.
The chart below shows top 10 websites with the best Google PageSpeed mobile score

The leader here is The Co-Op closely followed by Target. 3rd and 4th place are taken by The Nile and OzSale.
Top ten Google PageSpeed desktop score

Again The Co-Op leads with eStore in 2nd position and OzSale in 3rd.
Best performance grade (Pingdom) websites

The leader now is Beacon Lighting, followed by Target and EB Games
Overall performance of the top 10
Here we calculated a synthetic overall performance rate – a sum of Google Mobile Score, Google Desktop Score and Pingdom Performance Grade

Naturally there are leaders from the previous categories feature here, in the overall score Target is #1, Beacon Light is #2 and The Co-op is 3rd
Loading speed top 10
When we start to measure the loading speed of the home page however, the leaders are different:

You may notice some familiar names in the top-10, but the top 3 positions have other occupants – #1 is Strandbags with very impressive time to load of just above half second. The runner-up is Katies with less then 0.9 seconds load time and third place is taken by EzyDVD.
The conclusion
- Currently, Australia’s top retailers are not really obsessed with getting high Google PageSpeed scores, at least based on the results we see.
- What does this mean for your retail business:
- If your score is also mediocre, it is at least on par with competitors, so your ranking isn’t under threat
- Or you can consider it as an opportunity – better score – better ranking – more business from organic search results
- If your mobile UX score isn’t good, you should fix it immediately, leading players perform quite well in this metric, so with poor mobile UX score you are loosing business
- You can build a light and extremely fast retail website. If you don’t believe that it is possible check what guys from Strandbags, Katies, EzyDVD and other top 10 websites in this category have achieved. All these websites are fairly complex, but load in under 2 seconds. It isn’t easy or cheap, but possible (we at Magenable know first-hand).
**** In upcoming posts we plan to dig a bit deeper on the performance of the websites. This will be based on comparing the different platforms and other interesting stuff.
We will also publish full data with performance of all 100 retailers.
So stay tuned – subscribe to our newsletter (the banner is on the right hand column) and follow us on Twitter and LinkedIn.
References
- How loading time affects your bottom line, infographic (Kissmetrics)
- How Does Web Page Speed Affect Conversions, infographic (Web Performance Today)
- We Analyzed 1 Million Google Search Results. Here’s What We Learned About SEO, an article (Backlinko)
- Australian online retailers lagging behind global competitors when it comes to site speeds (Smart Company)
- Australian Retail Performance Benchmark (Dynatrace)


